오늘은 redis dashboard로 사용하기 위해서
Ubuntu에 Grafana를 설치하고
접속되는지까지 확인해보도록 하겠습니다.
(윈도우는 넘 어렵네요 ^___^, 하긴 했는데 플러그인이 잘 안됐어요...
그냥 .msi 다운받고 next만 눌러주고, http://localhost:3000 접속만하면 끝.)
1. Grafana 설치
https://grafana.com/grafana/download?platform=windows
Download Grafana | Grafana Labs
Overview of how to download and install different versions of Grafana on different operating systems.
grafana.com

위 그림대로 "Download the installer" 선택하시고 명령어를 수행해보겠습니다.
sudo apt-get install -y adduser libfontconfig1
wget https://dl.grafana.com/enterprise/release/grafana-enterprise_10.0.3_amd64.deb
sudo dpkg -i grafana-enterprise_10.0.3_amd64.deb
2. 서비스 실행
sudo service grafana-server start- ID: admin
- PW: admin
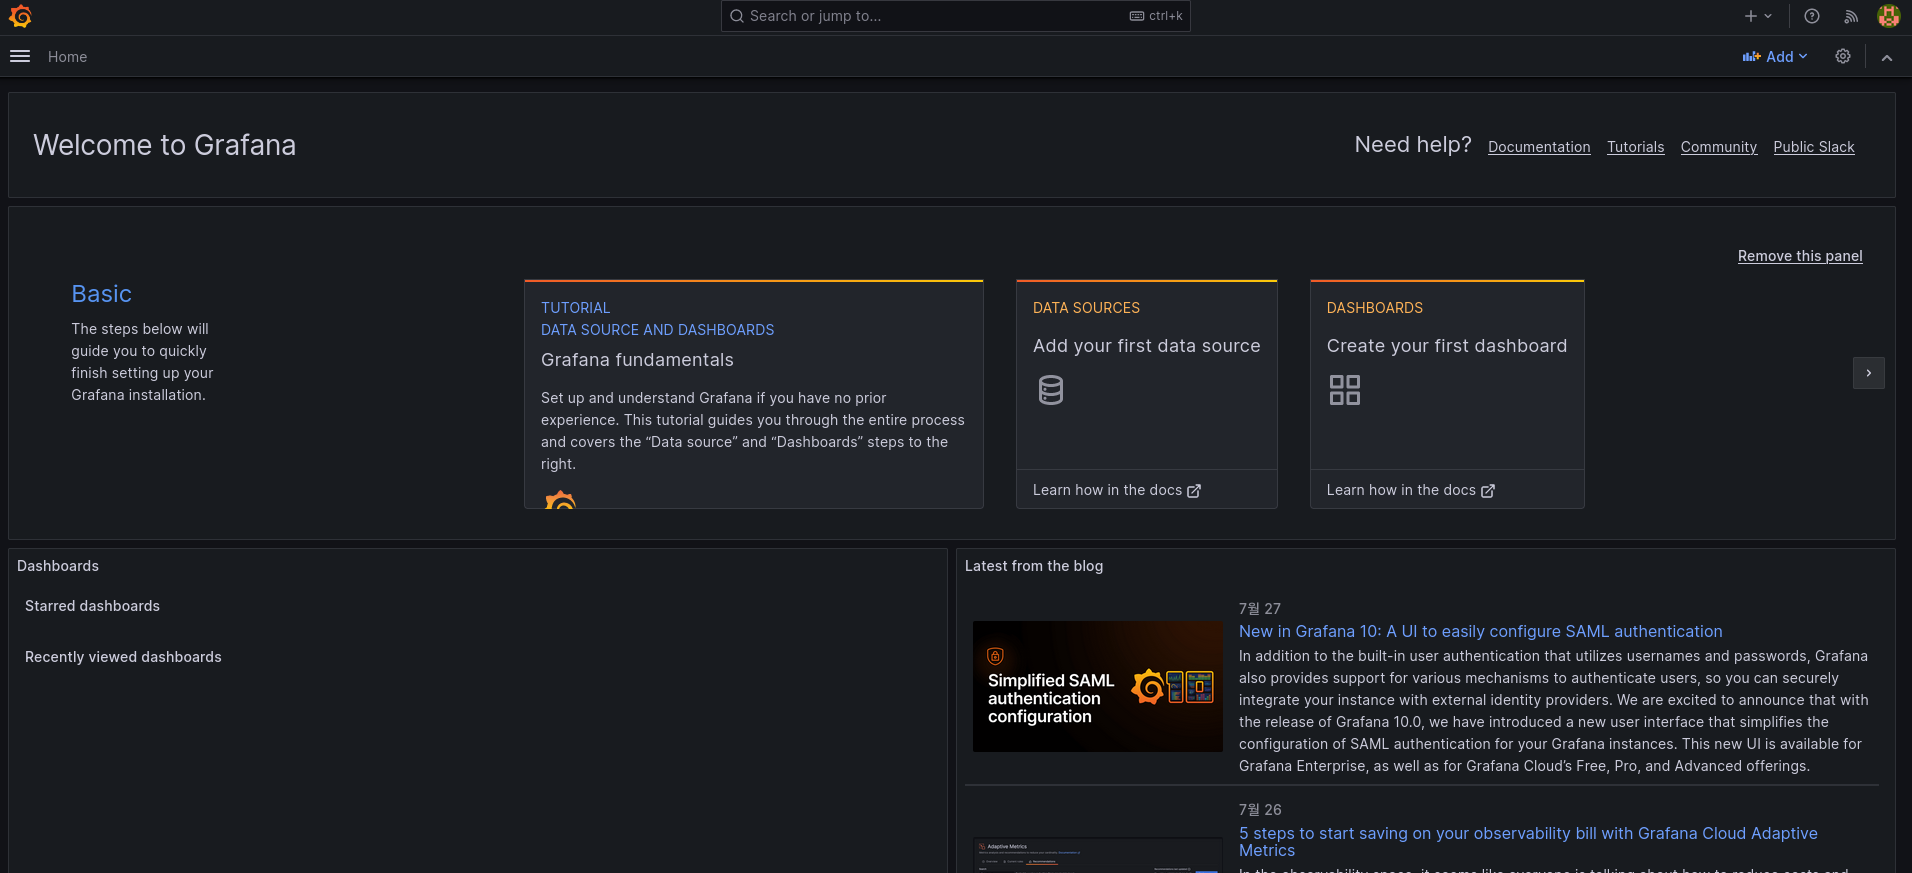
- http://localhost:3000 으로 접속
3. 서비스 상태 확인
sudo service grafana-server status
'MLOps' 카테고리의 다른 글
| Meta에서 더 가벼운 LLaMa2를 공개하다! LLaMa2 논문 리뷰 (0) | 2023.07.25 |
|---|